

The Microsoft Support Metric That Matters Most: Resolution Ownership
Enterprise support is often evaluated by the easiest number to publish: response time. That number matters, but it does not tell buyers how long the issue remained unresolved, how many handoffs occurred, who owned the case after escalation, or whether the published performance claim can be verified.
For IT and procurement teams evaluating Microsoft Unified Support, partner-led support, or third-party support providers, the more useful question is not simply, “How fast will someone respond?” The better question is, “How efficiently will this provider move our issue from open to resolved, and can they show how that performance is measured?”
This guide compares the support metrics buyers can actually use: response time, resolution time, escalation rate, and methodology. It also explains how DCG’s Enterprise Support model approaches the same test through direct senior-engineer engagement, measurable in-house resolution, and accountable escalation management.
Response Time, Resolution Time, and Escalation Rate Measure Different Things
Support claims can sound similar even when they measure very different outcomes. That creates risk for buyers because a provider can publish a strong response-time number while leaving the more important operational questions unanswered.
Response time measures how long it takes for a support provider to acknowledge a ticket and begin working on it. It is a useful service-level measure, but it does not show how long the underlying issue took to fix.
Resolution time measures the full window from ticket submission to confirmed closure. This is the metric most directly tied to business impact because the system remains degraded, impaired, or unavailable until the problem is resolved.
Escalation rate measures how often the provider must move the case beyond the team that initially received it. For third-party Microsoft support providers, this often means escalation to Microsoft. A lower escalation rate can indicate more work is being resolved by the provider’s own engineering team, while a higher rate may signal a more routing-heavy model.
The distinction matters because buyers do not experience support as a response-time SLA. They experience support as downtime, degraded operations, repeated context sharing, internal follow-up, and unresolved risk.
Why Resolution Time Data Matters to IT and Procurement
Every Microsoft support provider makes some type of performance claim. Some claims focus on response time. Others focus on cost savings, customer satisfaction, escalation access, or speed compared with Microsoft. Those claims can be directionally useful, but they become hard to evaluate when the provider does not also publish how the number was calculated.
For procurement, the issue is comparability. Two vendors can both claim a strong average resolution time while using very different ticket samples, severity mixes, product workloads, or calculation methods. One average may include simple administrative tickets. Another may focus on selected workloads. Without methodology, the headline number is difficult to validate.
For IT, the issue is operational impact. A ticket acknowledged quickly can still remain open for days. During that time, teams may be managing workarounds, explaining delays to internal users, repeating technical context, or escalating internally to maintain visibility. The business cost is tied to resolution, not acknowledgment.
The practical test is simple: a useful support claim should tell buyers what was measured, how it was measured, which work was included, how often cases escalated, and who remained accountable when escalation occurred.
The financial stakes behind that gap run high. A widely cited cross-industry benchmark puts the average cost of an outage at roughly USD 5,600 per minute, and a more recent industry survey puts the median cost for large enterprises closer to USD 9,000 per minute. When resolution time is the variable standing between a broken system and a working one, “faster” is not a marketing adjective. It is a number with a dollar figure attached, and buyers have almost no way to verify whose number is real.
Vendors sometimes overstate their capabilities to win a deal, and self-reported, unverifiable data makes that easier to get away with as evaluations move faster. Procurement teams already spend real time trying to catch it: a 2025 industry report on RFP practices puts the average RFP response at 20 to 28 hours of work. None of that effort can verify a claim that was never made checkable in the first place. A vendor that doesn't publish its underlying resolution or escalation data leaves nothing to check against.
Consider how this plays out in practice. A mid-size enterprise compares two vendors during an evaluation. Both publish an average resolution time. One number is calculated across every ticket the vendor handles, including simple password resets. The other is calculated only across the workloads that look most favorable. Both vendors can honestly call their number “average resolution time,” and a buyer reading the two headlines side by side has no way to tell them apart because neither vendor has published what sits underneath the average. The real issue is publishing a number without the method behind it.
What Each Vendor Discloses: A Side-by-Side Comparison
The Industry Pattern: What Each Vendor Publishes
What Microsoft Discloses About Support Response Time
Unified Support states initial response-time targets by severity level, for example under an hour for the highest-severity Azure cases, scaling upward across lower severities. That is a response-time commitment: how quickly an engineer begins working on a ticket.
Microsoft's public materials report response commitments only at the severity level. Azure, Microsoft 365, Dynamics 365, and security each carry very different levels of complexity, and a buyer running a security-heavy environment has no public data showing whether Microsoft's stated averages reflect their environment or those of a very different customer. Resolution time and escalation data broken out by workload simply isn't part of what Microsoft publishes.
This matters even more because of how broad Unified Support's coverage is. Unified Support bundles proactive advisory, mission-critical coverage, and reactive engineering across the full Microsoft suite under a single plan. That breadth is a genuine differentiator, but it also means a single published response-time target must stand in for a very wide range of underlying workloads, and buyers evaluating a specific workload are left to infer from a number that was never meant to describe it.
What Crayon Discloses About Resolution Time
Crayon's Support as a Service describes its Basic and Premium tiers in terms of 24/7, multi-channel coverage, certified agents, and a language emphasizing reduced downtime and faster issue resolution. They discuss one category of speed metrics: call-answer performance, with public figures citing roughly half of calls answered in under 30 seconds and 90% in under 48 seconds.
That figure measures how quickly the phone gets picked up, a response metric. Crayon's current public support pages report only call-answer speed for both tiers, with no average resolution time or escalation rate published alongside it. How long the ticket actually stays open and how often it moves beyond the first line of support fall outside what they currently publish.
Crayon's model is built around white-label help desk augmentation for partners who need scalable ticket handling without hiring their own front line. That is a reasonable position to sell from, and the fast-answer metrics support it. But a partner deciding whether Crayon's Basic or Premium tier can actually absorb their ticket volume is choosing based on how fast the phone gets picked up, with no public figure for how long the underlying work takes once it does.
What US Cloud Discloses About Escalation Depth
US Cloud's headline public claim is that its average resolution time runs faster than Microsoft's, positioned as a direct speed comparison against Unified support. That comparison stands alone on US Cloud's public pages, without the ticket sample, time period, or calculation method needed for a buyer to verify it.
A speed claim measured against a single competitor, without the escalation data or methodology to support it, tells a buyer less than it appears to. It answers “faster than what.” The question of “faster at doing how much of the work” stays open.
That question matters most for a vendor whose entire pitch is built on speed and cost savings relative to Microsoft. US Cloud landed on the 2025 Inc. 5000 list with 250% three-year revenue growth [6], and that growth curve means more buyers encounter the “faster than Microsoft” claim during evaluation every year. The bigger that funnel gets, the more a published methodology behind the headline number would matter to the buyers relying on it.
What Buyers Can Verify from Public Support Claims
A fair comparison should separate what each provider publicly states from what remains unpublished or unclear. The goal is not to penalize a provider for using a different model. The goal is to help IT and procurement teams understand which claims are measurable, which claims are directional, and which claims require follow-up during evaluation.
What DCG's Numbers Show
Our Enterprise Support resolves cases in an average of 5.8 hours, with 92% resolved in-house and only 8% requiring escalation to Microsoft. Taken together, those numbers indicate how much of the resolution process stays inside the support team that originally receives the issue.
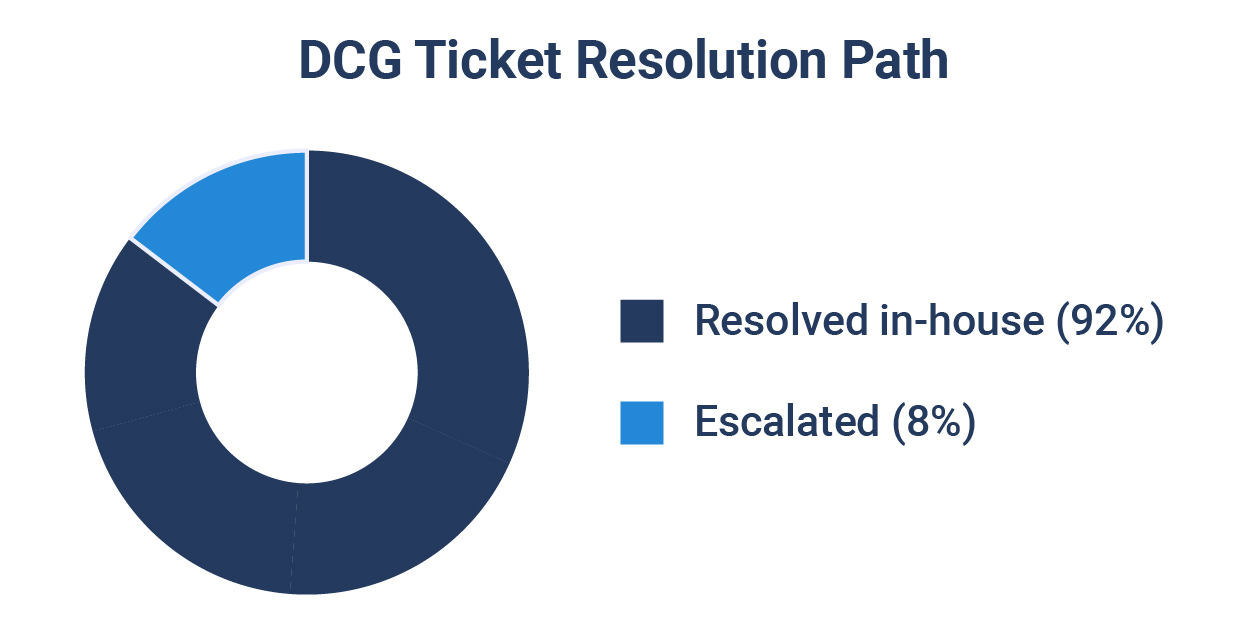
DCG routes cases directly to senior engineers rather than using multiple support tiers as the default path. When Microsoft escalation is required, DCG remains accountable for the case through resolution. That reduces the operational burden on the customer: fewer handoffs to manage, less context to repeatedly transfer, and clearer ownership of the outcome.
That is the more useful measure of enterprise support efficiency: not how quickly a ticket enters the system, but how efficiently the problem gets out of it.
For a detailed methodology and in-depth cost breakdown, refer Support Cost Breakdown -2026 whitepaper.
Run Your Own Numbers
A support provider should be evaluated by the work it actually owns. Response time indicates when the conversation starts for buyers. Resolution time, escalation rate, and methodology tell buyers whether the provider can move the issue to closure with accountability. That is where DCG’s Enterprise Support model is designed to stand apart: senior engineers engage earlier, most cases are resolved in-house, and Microsoft escalation is managed without handing the burden back to the customer.
Unified Alternative Calculator lets you put that difference into financial terms.
Compare your current Microsoft support spend with an alternative support model to see the potential short- and long-term savings for your support environment.

.png)