
Analysis reports in Dynamics 365 are custom reports based on records of your posted transactions. Sales managers can analyze turnover and KPIs, whereas purchasers can study volumes and pricing. Within these customizable reports, the source data can be combined, compared, and presented in meaningful user-defined ways. This blog post will explain how to set up line and column layouts, how to set up analysis templates, and how to create a new sales analysis report in Dynamics 365.
All About Analysis Reports
Analysis reports are very similar to PivotTable reports in Microsoft Excel. Personalized reports can be created to show total turnover in amounts sold and gross profit and compare them to figures with results from previous months or years. This can all be displayed within one view. Objects such as customers, customer groups, and salespeople can be analyzed and represented as specific columns. They can be organized as profit calculations, periodic comparisons of sales amounts and volumes, or periodic comparisons of actual and budgeted figures.
Setting up Line and Column Layouts
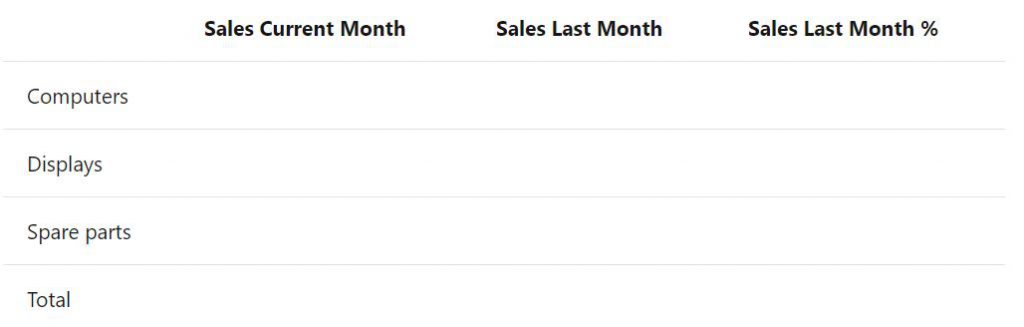
On the Analysis Report page, different lines and column layouts can be set up. You can customize exactly what you want to display on the Analysis Line Templates page. Names can be defined, and objects can be selected depending on what needs to be detailed on the report. The Analysis Column Templates page defines the name of the column template and analysis parameters that should be shown in the report as columns. Each separate line represents a column in your report. Here’s an example:
How to Set Up Analysis Column Templates
Analysis parameters are shown as columns. You can set up as many column templates as you want and use them to create new analysis reports. Here’s how:
1. Choose the search icon, enter Sales Column Templates, and then choose the related link.
2. Select the first empty line, and then fill in the fields as necessary.
3. Choose the Columns action.
4. On the Analysis Columns page, fill in the fields to specify the columns that you want to include in your analysis report.
5. Choose the OK button to save changes.
PRO TIP – To define a column, you must fill in the Analysis Type Codes field for all column types except Formula. Set up the analysis type codes on the Analysis Types page.
Also, in the Ledger Entry Type field, if you select Item Entries, the actual figures from the item ledger entry are copied. If you select Item Budget Entries, the budgeted figures from the budget are copied.
How to Set Up Analysis Line Templates
In an analysis report, the analysis objects are shown on the lines. Lines will include the information that is set up in analysis line templates. Templates contain a set of lines representing the analysis lines that will eventually be shown in the report. Lines can specify one or a range of items including customers, vendors, or groups. Here’s how to set one up:
1. Choose the search icon, enter Sales Line Templates, and then choose the related link.
2. Select the first empty line, and then fill in the fields as necessary.
3. Choose the Lines action.
4. On the Analysis Lines page, create lines for the items, customers, vendors, or salespeople you want to view figures for in your analysis report. You must fill in the Type, Range, and the Description fields.
PRO TIP – When you want to create many individual lines for each item, customer, and so on, you can select the appropriate insert option to fill in all the relevant fields on the line. If you need to, you can then edit the lines manually. To insert lines, choose the Insert Items action or the Insert Item Groups action.
How to Create a New Sales Analysis Report
As stated above, analysis reports can help analyze important data according to KPIs, turnover, contribution margin, or progress of sales versus budget. Here is how to create one:
1. Choose the search icon, enter Sales Analysis Reports, and then choose the related link.
2. On the Analysis Report Sale page, choose the New action.
3. Fill in the fields as necessary. Hover over a field to read a short description.
4. Choose the Edit Analysis Report action.
5. On the Sales Analysis Report page, choose the Show Matrix action
PRO TIP – Building combinations of line and column templates to create reports and assigning them unique names is optional. If you do this, selecting a report name means that you will not need to select line and column templates on the Sales Analysis Report page. After you have chosen a report name, you can change line and column templates independently and then later select the report name again to restore the original combination.
If you have any specific questions on how to configure analysis reports, send us an email. Dynamic Consultants Group is a team of Solution Architects, Consultants, and Developers that can assist you with any type of project. We would love to hear from you!

