
This blog was written by Power Learn Academy Apprentice and Power Platform Functional Consultant Derek Morrison.
Discovering some of the core functionalities of Power BI can help convert data into usable findings, providing organizations with valuable insights to drive strategic decisions. Through features such as Data Visualizations, DAX (Data Analysis Expressions), Power Pivot, Power BI Q&A, and Mobile Accessibility, users can delve into data trends, perform advanced calculations, establish data relationships, collaborate in real-time, and access reports on-the-go. Unlock the potential of your data journey with Power BI’s dynamic capabilities, igniting a revolution in how your organization harnesses information. From crafting captivating visual narratives to harnessing the power of predictive analytics, Power BI empowers you to elevate your decision-making to unprecedented heights, transforming raw data into strategic goldmines with ease and finesse.
5 Essential Core Power BI Functions
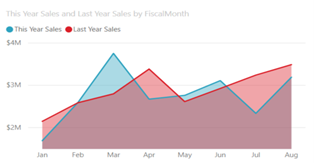
1. Data Visualization
Power BI provides a variety of data visualization options, including charts, graphs, maps, and tables. This feature enables users to create visually compelling reports and dashboards that facilitate data interpretation. Visualizing data not only enhances understanding but also enables stakeholders to identify trends and patterns quickly.
2. DAX (Data Analysis Expressions)
At the heart of Power BI is DAX, the formula language that enables users to create calculated columns and measures. DAX uses advanced calculations, aggregations, and time-based analysis to empower users to obtain meaningful insights from their data. With DAX, users can perform complex calculations with ease and unlock deeper layers of understanding within their datasets. In retail analytics, DAX can be used to calculate customer lifetime value (CLV), incorporating factors like purchase frequency and average order value. By leveraging DAX functions, analysts gain insights into customer behavior, enabling strategic decisions in marketing and resource allocation.
3. Power Pivot
Power Pivot restructures data modeling by allowing users to create robust data models, establish relationships, and perform calculations seamlessly. With Power Pivot, users can work with large datasets efficiently and build extensive relationships to uncover insights hidden within the data. Its integration with Excel provides users with a familiar environment, ensuring ease of use and familiarity for Excel users.
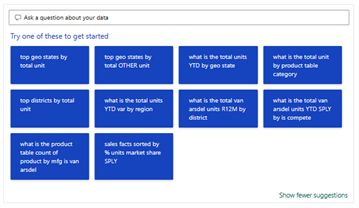
4. Power BI Q&A (Question & Answers)
The Q&A visual feature within Power BI offers users the capability to pose questions using natural language and receive informative visual responses. This functionality proves particularly advantageous for business users seeking to promptly obtain insights from their report data, allowing them to efficiently navigate and extract relevant information.
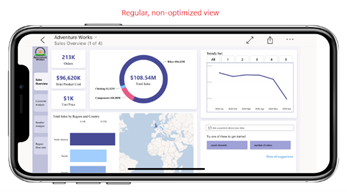
5. Mobile Accessibility: In today’s fast-paced world, access to data on-the-go is essential. Power BI offers mobile apps for iOS and Android devices, enabling users to access reports and dashboards anytime, anywhere. This mobile accessibility ensures that stakeholders stay connected to critical insights, empowering them to make informed decisions even when they are away from their desks.
Businesses utilize Power BI for streamlined data analysis and visualization, benefiting from its intuitive interface, diverse visualization options, and robust data modeling capabilities. Integration with Microsoft products, cloud-based architecture, and mobile accessibility further enhance the decision-making processes, promote collaboration, and drive growth. Dynamic Consultants Group can help you scale your business processes while enhancing decision-making within your organization through the Power BI’s core functions, schedule a meeting with us today to learn more!

