
Tickets That Took Too Long
IT leaders do not get measured on acknowledgement times. They are more focused on internal client satisfaction, systems up time, restoration, recurrence prevention and the speed at which the right engineer takes ownership. That is why a fast initial response can still lead to tickets that remain open far longer than the business can accept.
Microsoft defines initial response time as the period from when a support request is submitted to when a Microsoft Support Engineer contacts you and starts working on the request. That definition matters because it is not the same as time to resolution and it does not guarantee time for a workload specific engineer for complex incidents.
"The Initial Response Time varies with both the support plan and the Business Impact of the request."
This blog explains where time goes inside a triage heavy support flow, why that time creates operational and financial drag and what a direct to engineer approach like DCG Advanced Support changes immediately.
If you need a quick refresher on incident metrics such as MTTR and MTTA, see: Atlassian’s incident management metrics overview and ServiceNow’s MTTR explainer.
What Happens to a Ticket Inside Unified Support
Tiered support exists for a reason: it helps large providers scale across thousands of customers. But in complex Microsoft estates, scale optimized triage can create predictable delay patterns. You see the symptoms as slow routing; repeated evidence requests and long mean time to repair (MTTR).
A typical triage heavy path includes:
- Intake: gather logs, scope, timestamps, environment context and reproduction steps
- Queueing and routing: assigning the case to a product area and severity lane
- Re-triage and handoffs: repeat validation when ownership changes
- Engineer analysis: deep diagnosis once the right specialist engages
- Fix and validation: implement remediation, test and close with documentation
Help Scout notes that a dedicated triage role can help teams prioritize the queue so others can take the next conversation without missing something critical. That is good operational advice, but it also reveals the core trade off: triage is a queue control function and queues create waiting time. For an accessible overview, see Help Scout’s queue management guidance.
Illustrative example showing how queue wait and re-triage time can dominate elapsed ticket duration before specialist analysis begins. Source: Help Scout and DCG analysis.
Incident Metrics that Expose Hidden Delay
If your reporting stops at acknowledgement SLAs, triage delay remains invisible. Atlassian highlights the common incident metrics MTTA, MTTR, MTBF and MTTF and notes that MTTR can mean different things depending on whether the R stands for repair, recovery, respond or resolve. ServiceNow defines MTTR as the average time taken to fix or restore a failed system, component or otherwise resolve an issue.
"The R can stand for repair, recovery, respond or resolve."
For support model evaluation, add one more metric that most teams track informally: Time to Engineer. If Time to Engineer is measured and enforced, triage time cannot hide inside the ticket timeline.
The True Cost of Triage Delays
Triage delay creates two categories of cost: business interruption cost and internal operational drag. When systems are degraded, even if they are not fully down, teams burn time in updates, evidence gathering and parallel investigation.
ITIC reports that the average cost of a single hour of downtime exceeds 300,000 US dollars for over 90 percent of mid-size and large enterprises. IDC benchmarking has also cited an average hourly cost of an infrastructure failure at 100,000 US dollars and a critical application failure at 500,000 to 1,000,000 US dollars per hour. ITIC 2024 Hourly Cost of Downtime Report
"The average cost of a single hour of downtime now exceeds $300,000 for over 90% of mid-size and large enterprises."
"The average hourly cost of infrastructure failure is $100,000 per hour.
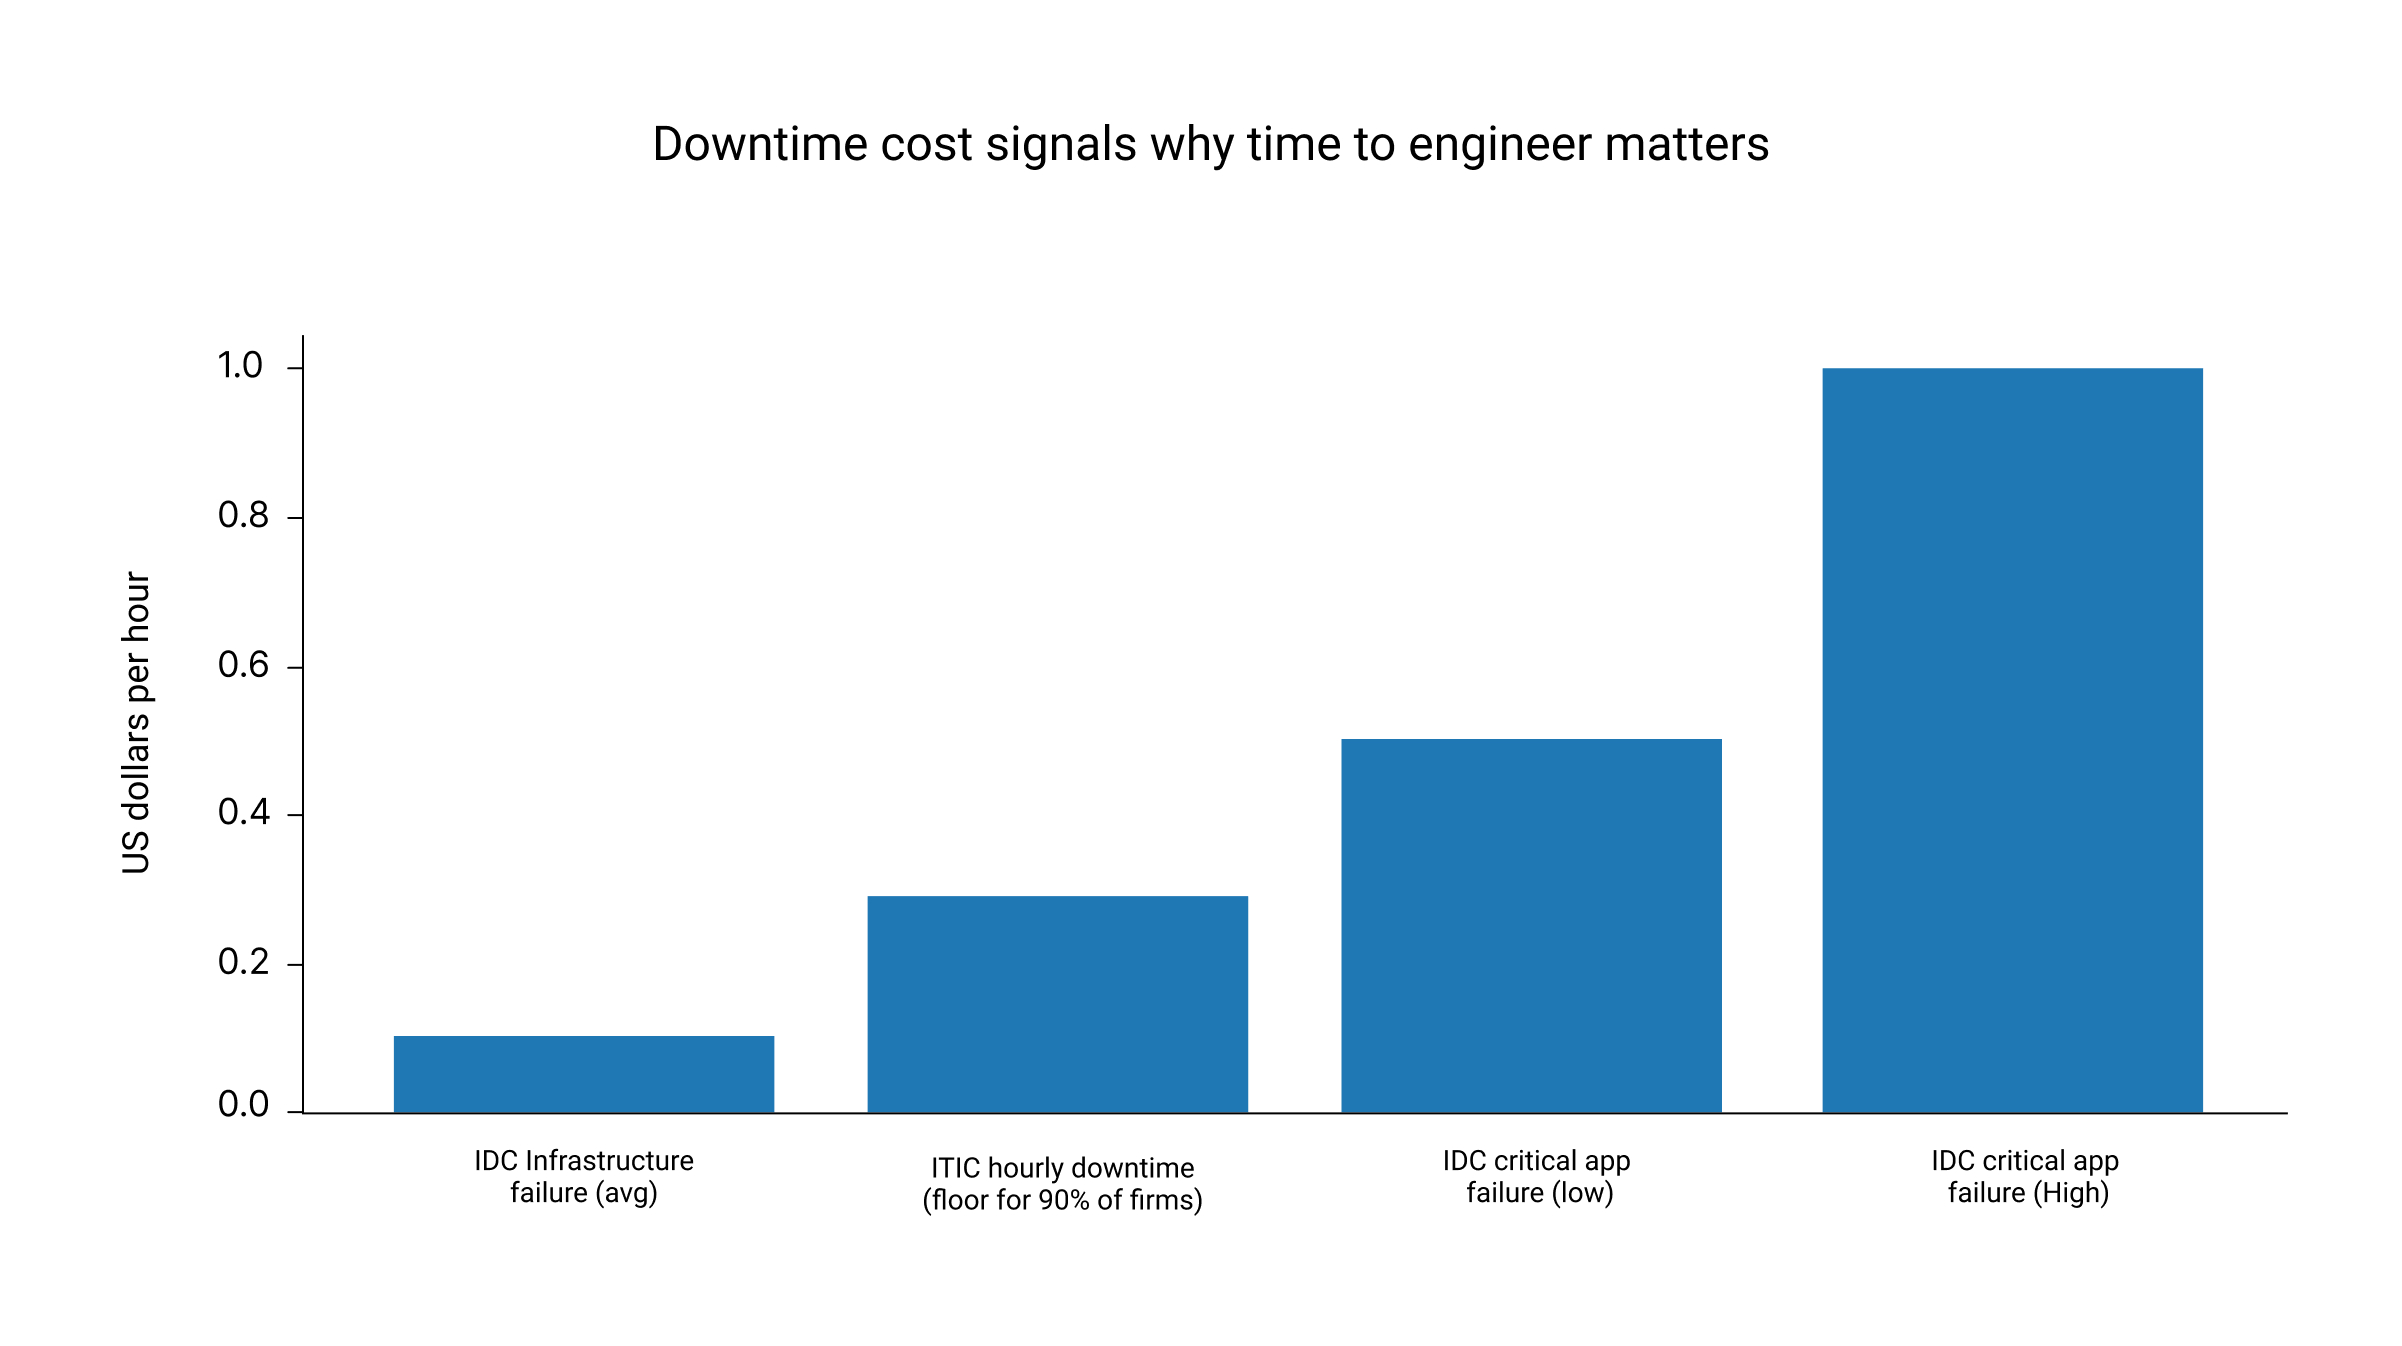
Data points compiled from ITIC (hourly downtime survey results) and IDC (DevOps and the cost of downtime). IDC DevOps and the Cost of Downtime (Fortune 1000)
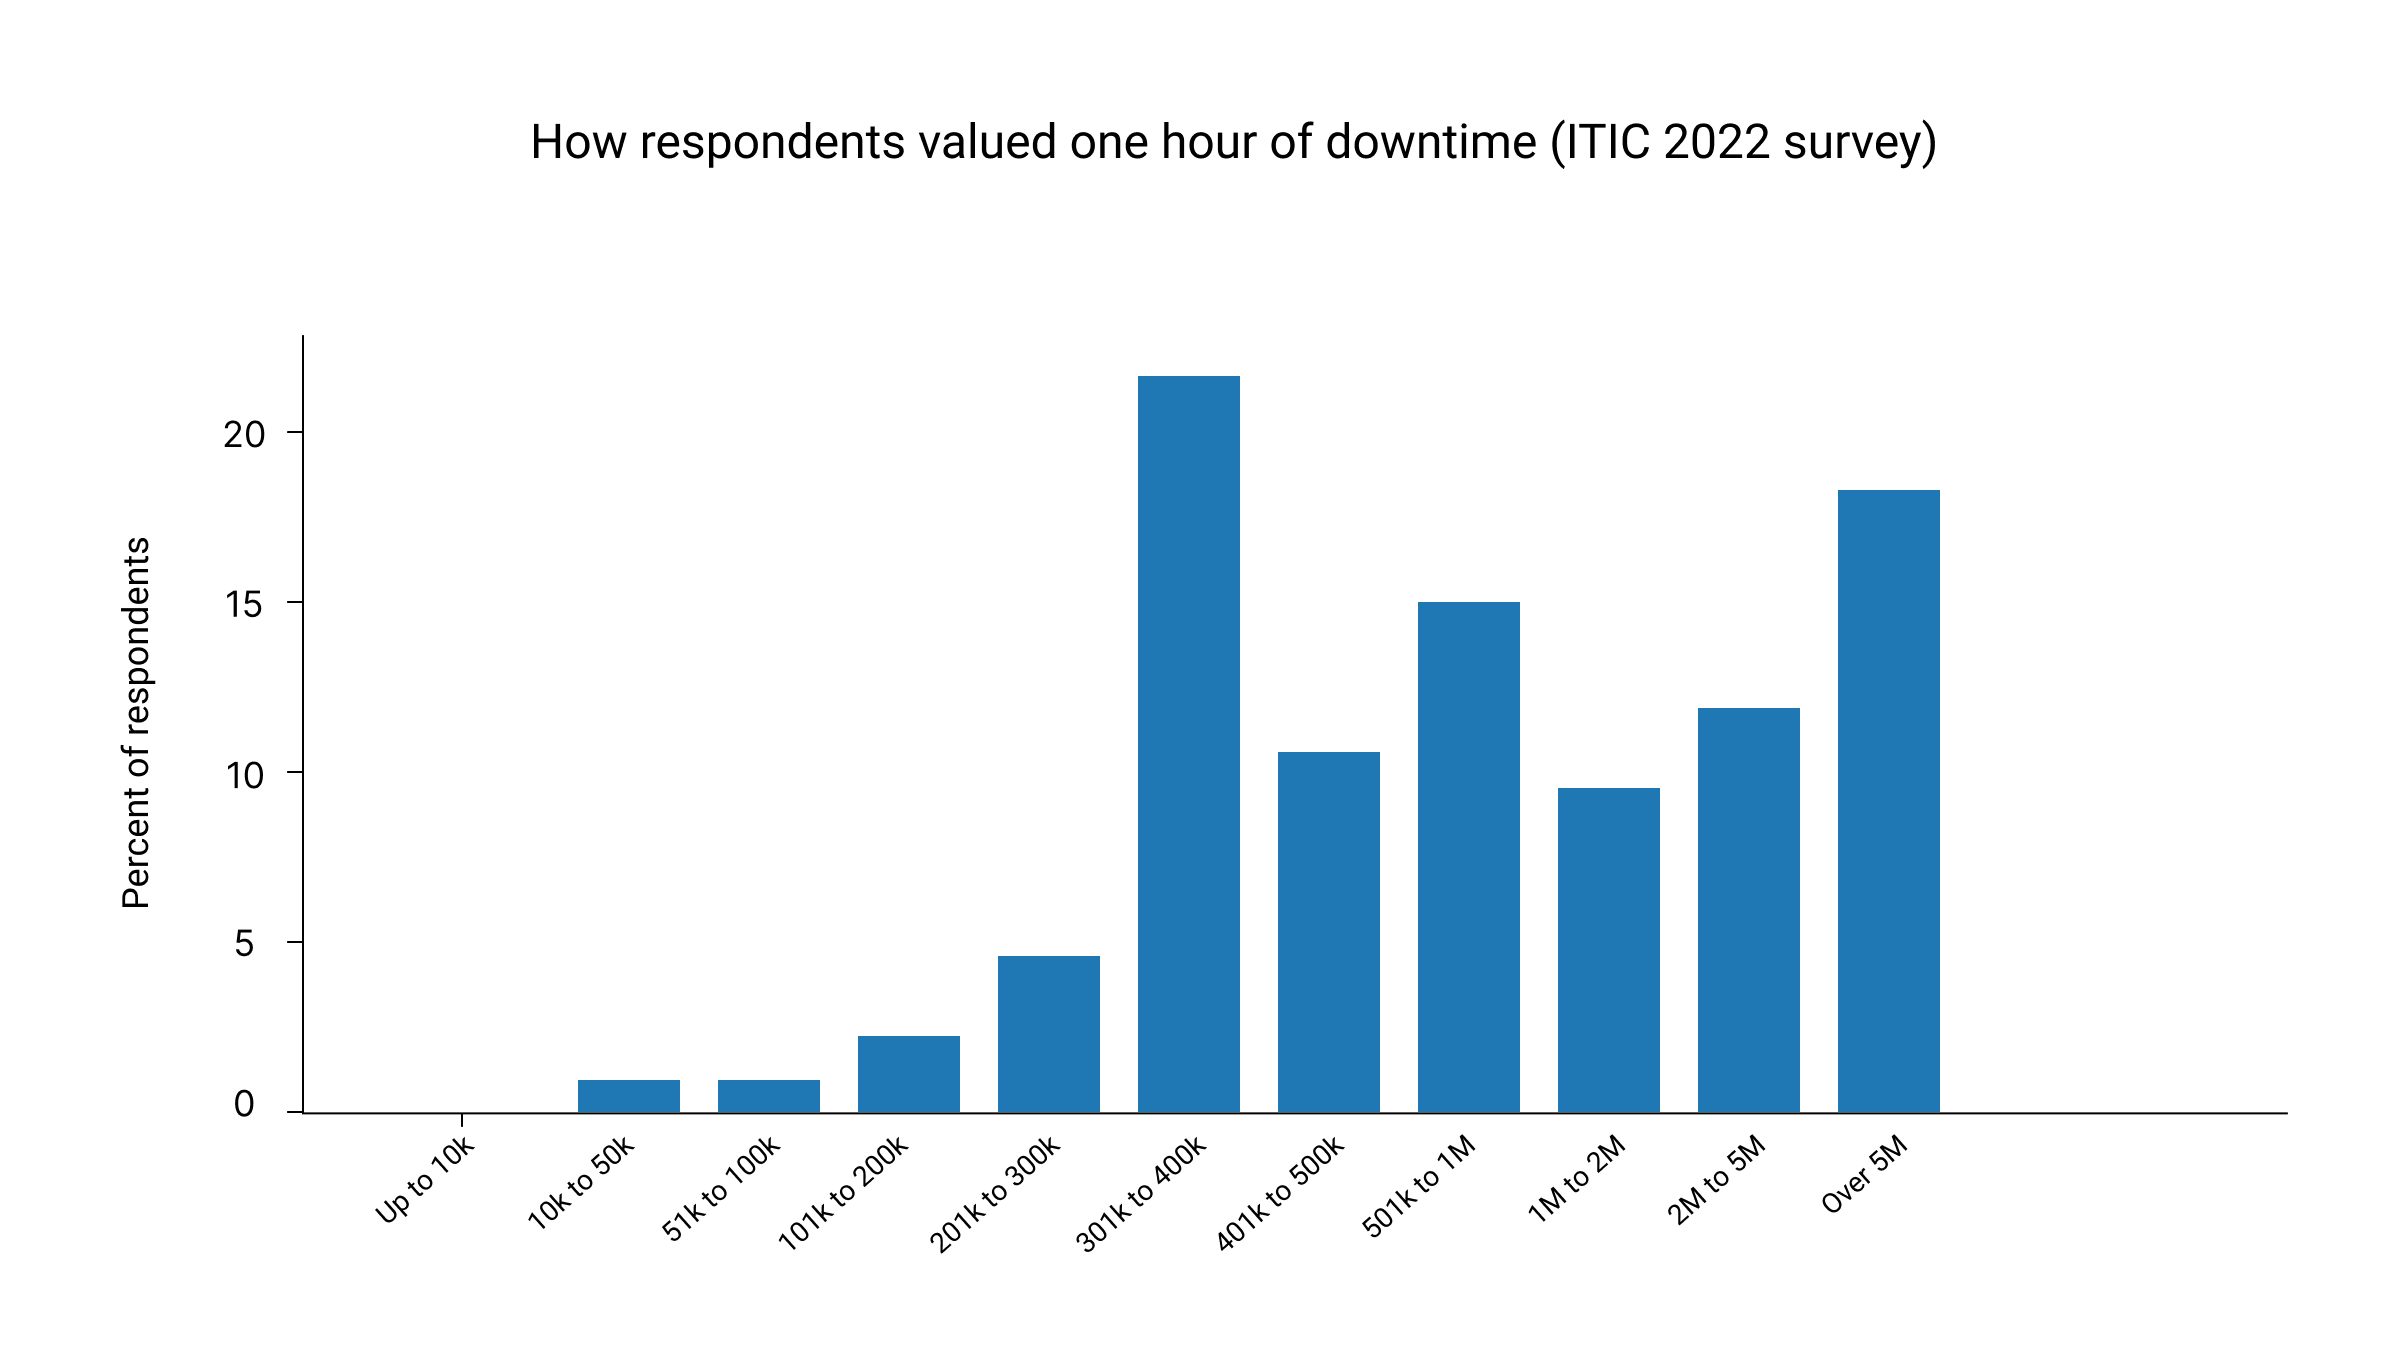
Distribution reproduced from an ITIC survey exhibit showing hourly downtime cost bands and respondent percentages. Source: ITIC 2024 survey and IDC Fortune 1000 analysis.
Queue time also creates security exposure. Modern CISO priorities emphasize rapid detection and response because the window between disruption and remediation is where business risk expands. See: SAFE Security’s 2025 cyber risk priorities.
AlertOps frames downtime cost as a function of potential revenue, lost productivity and recovery costs. This is the most useful way to talk about cost internally because it lets you model your own environment instead of relying on broad averages.
Three Tickets That Took Too Long
These are anonymized composite scenarios based on common patterns in large Microsoft estates. The goal isn’t to criticize it’s to make the “delay mechanics” visible.
Scenario 1: Identity access outage with Conditional Access complexity
Symptoms: Users can’t authenticate critical apps; sign-ins fail intermittently across geographies.
Why does it stall: Frontline requests focus on basic auth flows and generic sign-in logs. Meanwhile, the environment includes Conditional Access policies, device compliance, multiple IdPs/apps, and geo-based controls.
Delay pattern:
- Day 0: initial response achieved quickly, but first 6–12 hours are spent collecting baseline artifacts
- Day 1: reproduction attempts don’t match production paths (policy ordering, token behaviors)
- Day 2: case escalates; engineering context arrives late; mitigation already implemented internally
Outcome: Business continuity restored internally, but RCA and recurrence prevention lag.
Scenario 2: Azure networking degradation across hybrid connectivity
Symptoms: Intermittent packet loss, timeouts to platform dependency, sporadic VM reachability.
Why it stalls: Triage asks for standard traces; each handoff adds “prove it again” friction: timestamps, regions, correlation IDs, routing tables, flow logs, provider involvement.
Delay pattern:
- Multiple artifact cycles (flow logs, packet captures, gateway metrics)
- Shifts between “customer networking” vs. “platform issue” hypotheses
- Escalation happens only after repeated validation steps
- Outcome: MTTR extends because the ticket is “in motion” but not advancing.
Scenario 3: Microsoft 365 service issue with tenant-specific edge cases
Symptoms: Mail flow or collaboration features behaves inconsistently; a subset of users affected.
Why it stalls: Multi-tenant services require careful isolation; frontline steps can become generic because tenant-specific nuance is hard to encode quickly.
Delay pattern:
- Day 0–1: scripted troubleshooting steps and data requests
- Day 2: escalation; investigation begins after data completeness thresholds are met
- Day 3+: resolution may be fast once the right team engages—but the clock already ran
- Outcome: Ticket duration feels disproportionate to the eventual fix.
Across all three, the common thread is not incompetent. Its structure: triage-first support creates delayed access to workload-specific engineering context.
The Gap Between Cost Paid and Value Received
Microsoft Unified plan details describe pricing as applying a rate to historical annual IT spend by product class called product spend and it publishes expected response times by severity. This can create a mismatch for IT operations: support costs may rise with cloud consumption even when ticket volume falls and the spending does not map cleanly to engineer or resolution durability.
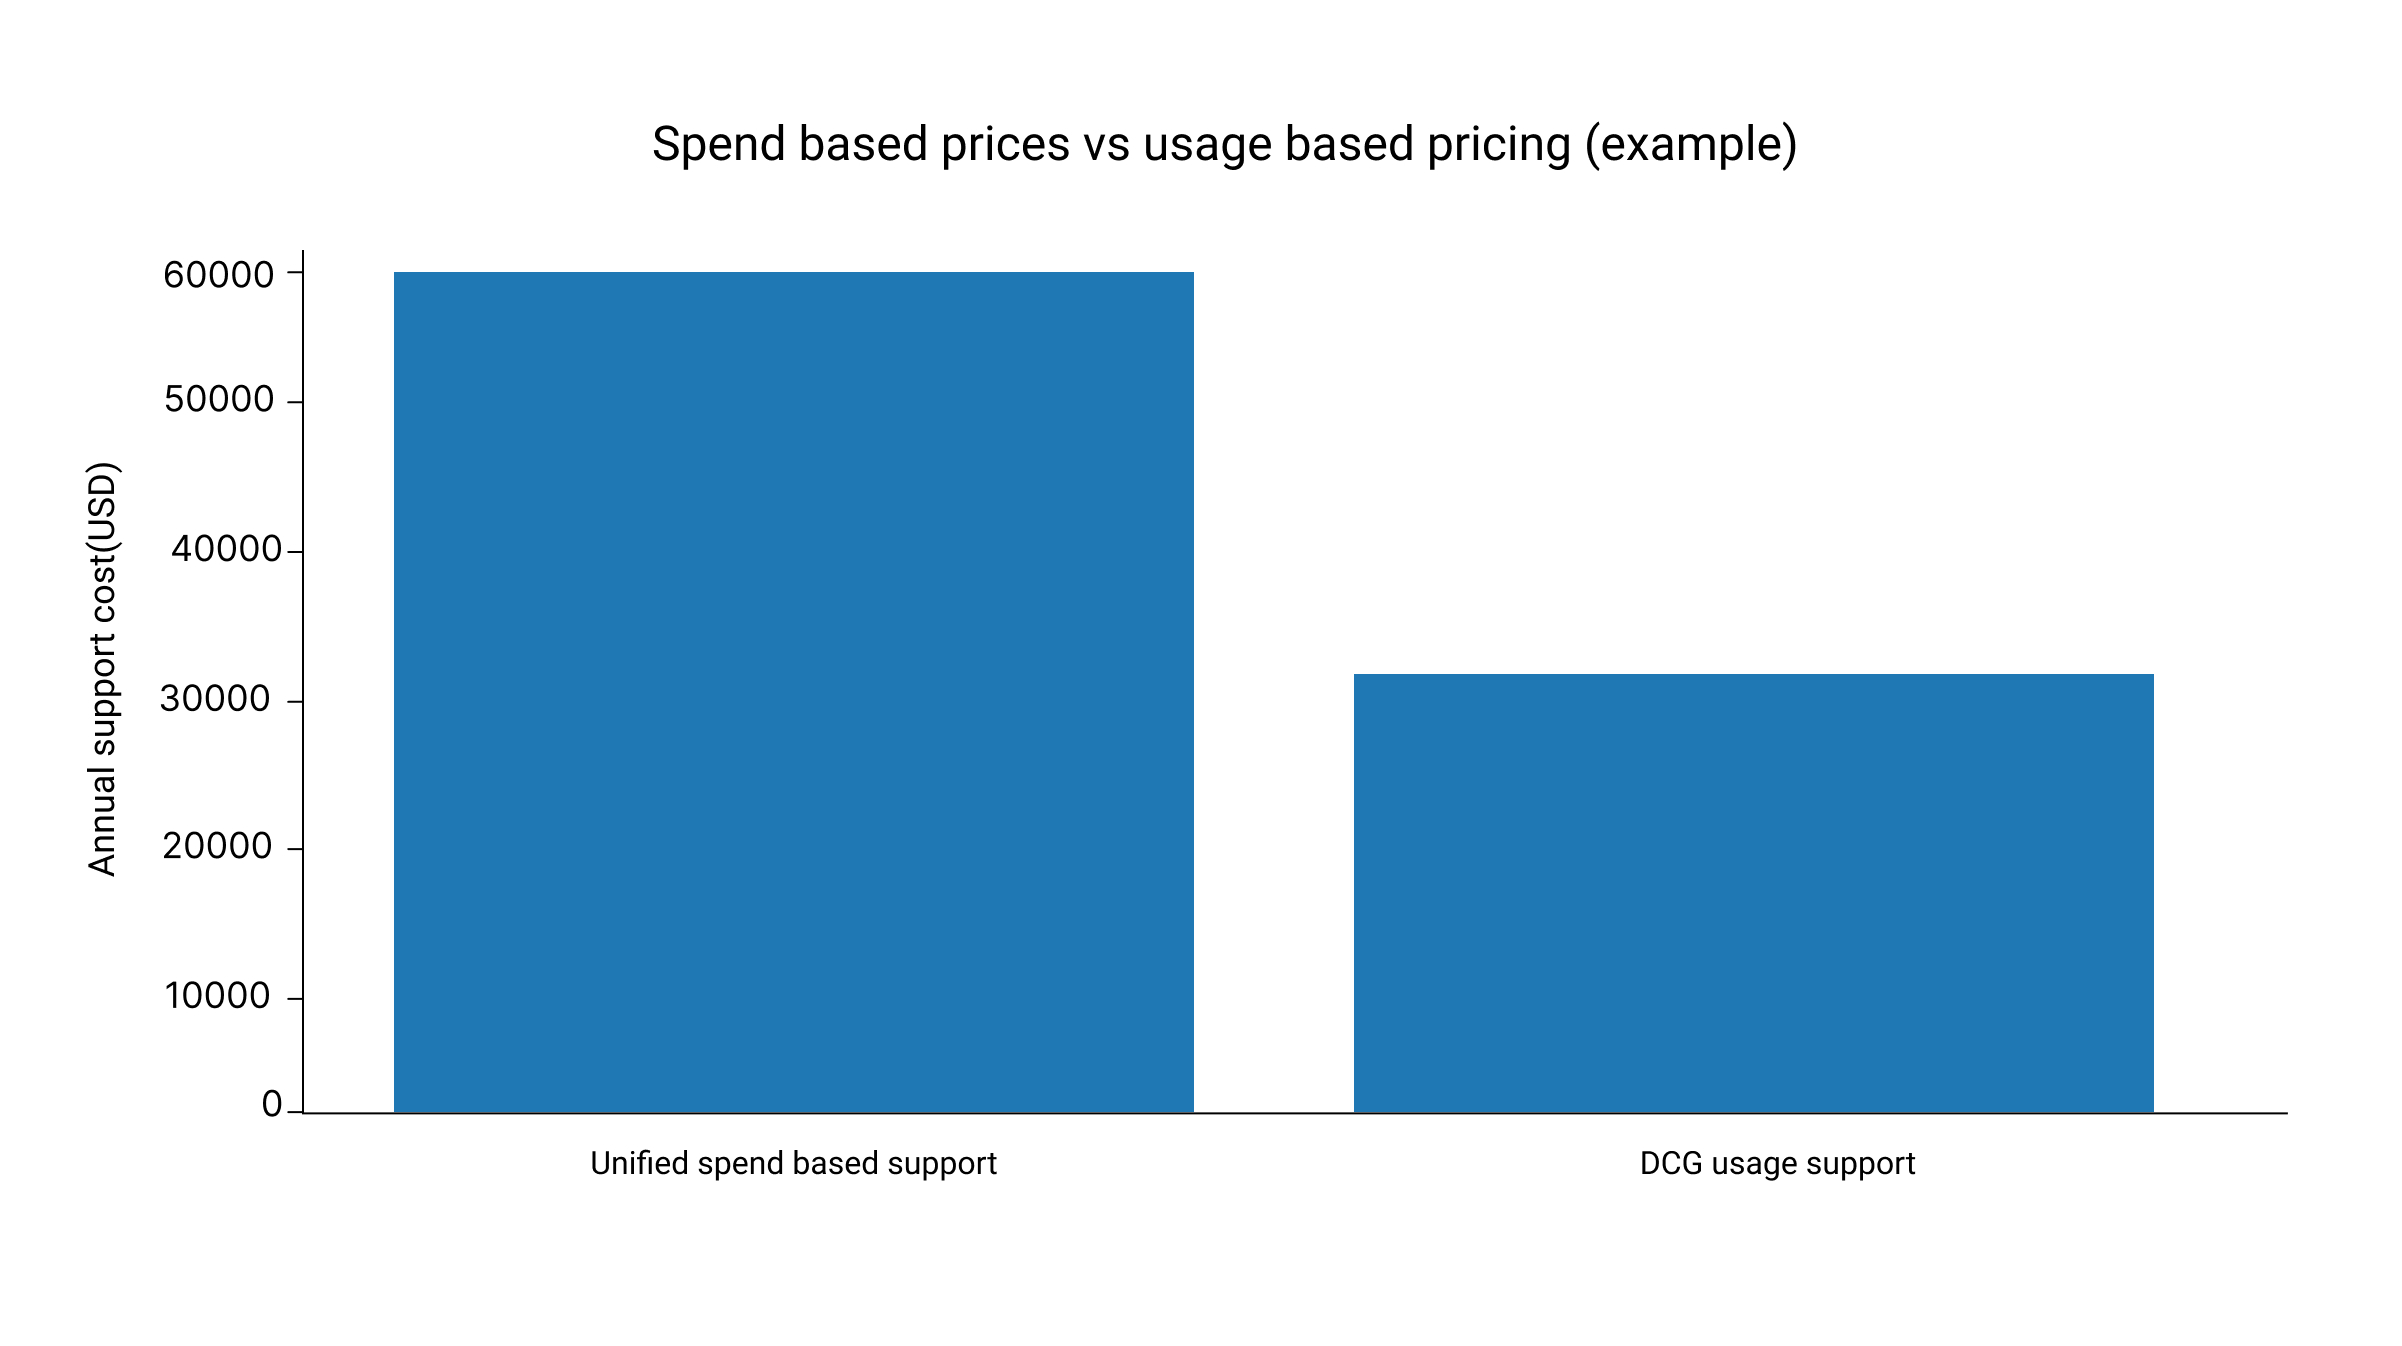
What changes in the cost model (Unified versus DCG)
What partner led support corrects immediately
Partner led support is not a softer version of Unified Support. It is a different operating model. DCG Advanced Support is designed to reduce MTTR by reducing queue time, reducing handoffs and increasing engineer context from the first touch.
What DCG changes in practice:
- Direct to engineer routing so specialist work begins earlier in the ticket timeline
- Time to Engineer SLA so the first engagement is tied to real troubleshooting, not only acknowledgement
- One consistent point of contact to eliminate repeated storytelling and context resets
- Deeper RCA and recurrence prevention so tickets do not come back as new incidents
- Usage based pricing and transparent reporting so spend maps to real engineering effort and outcomes
This model also aligns with how modern platform teams reduce friction: platform teams standardize approaches, reduce duplication of work and improve organizational efficiency. When support partners operate as an extension of the platform function, resolution becomes faster and more repeatable.
Evaluation checklist
Use this checklist to diagnose whether long ticket duration is a one-off event or a predictable outcome of the current support architecture.
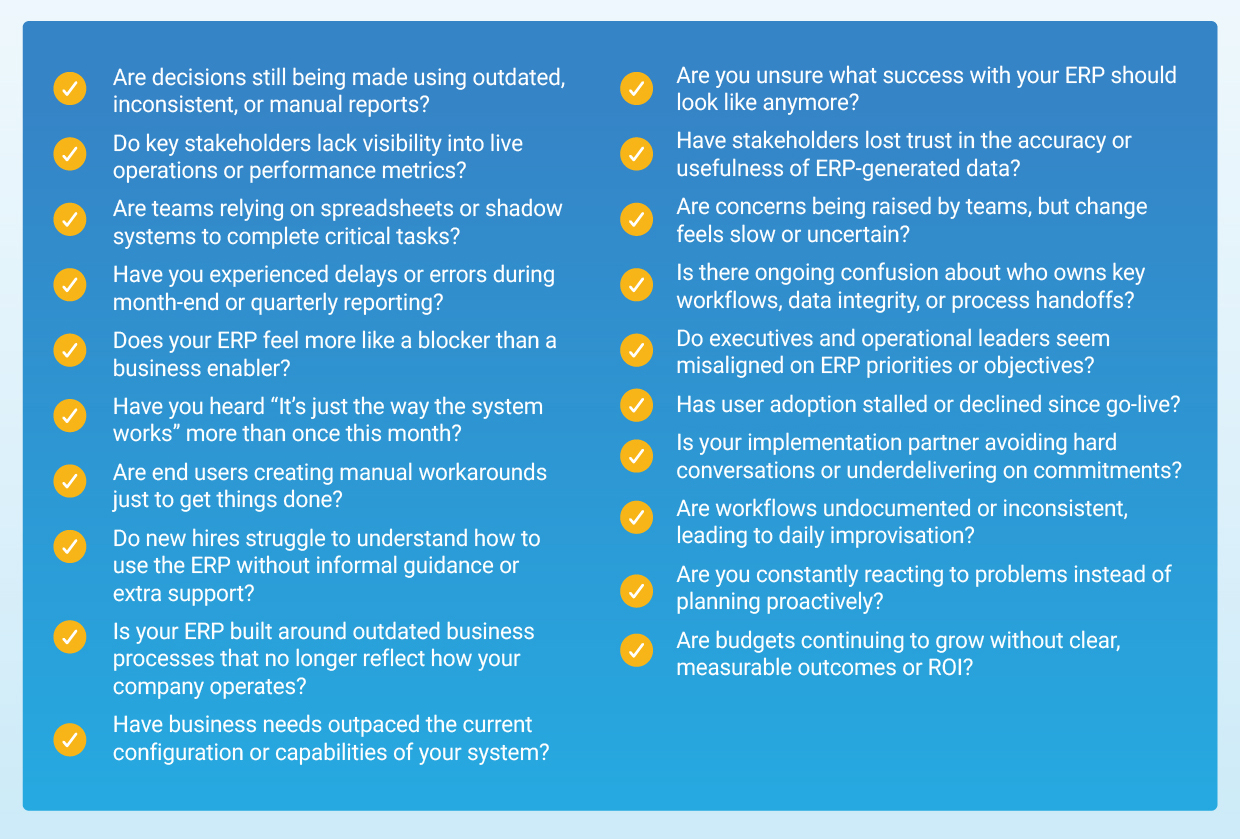
If you can't answer 8-9 confidently, you’re not alone and that’s exactly where a usage analysis becomes valuable.
%202.png)
.png)